


AI Performance: AI-related ECG Journal Articles
Physician-friendly AI concepts

Fun Fact
The term “statistician” comes from the root word “state”, because statisticians were the people who calculated information like births, deaths, and other information for the government, or state. Statistics (dealing with data) was a separate field from probability (more math/calculus-related) until the 19th century.
AI Words of the Week
True Positive Rate - sensitivity, recall
True Negative Rate - 1-sensitivity
Precision - Positive Predictive Value (PPV)
Area Under the Curve - how likely the algorithm is to classify things correctly; usually True Positive Rate on Y axis and True Negative Rate on X axis
Concept of the Month: AI Performance
This month we’re going to look at measures of AI performance, how they’re used in AI and medical journal articles, as well as in real-life use cases.
Let’s look at two papers in the past few months about ML models making clinical predictions based on ECGs, one that showed that ML models can distinguish CKD baked on ECGs, and another that can distinguish occlusive myocardial infarctions on ECGs better than experts.
We’re going to focus on the Results section of the abstract, because let’s be honest: that’s what you’ll mostly be reading unless you’re really interested in the topic.
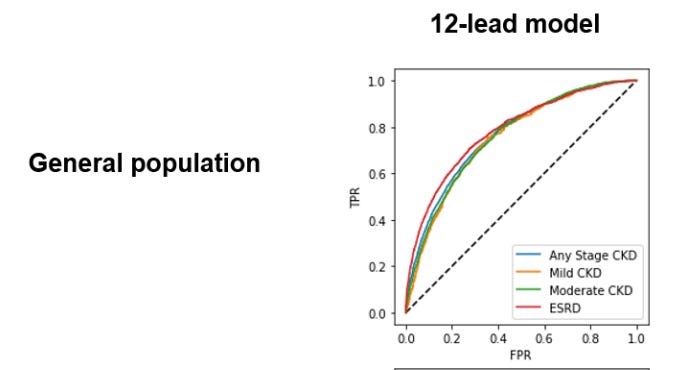
Deep learning-based electrocardiographic screening for chronic kidney disease
Results
“Using 12-lead ECG waveforms, our deep learning algorithm achieves discrimination for CKD of any stage with an AUC of 0.767 (95% CI 0.760–0.773) in a held-out test set and an AUC of 0.709 (0.708–0.710) in the external cohort. Our 12-lead ECG-based model performance is consistent across the severity of CKD, with an AUC of 0.753 (0.735–0.770) for mild CKD, AUC of 0.759 (0.750–0.767) for moderate-severe CKD, and an AUC of 0.783 (0.773–0.793) for ESRD. In patients under 60 years old, our model achieves high performance in detecting any stage CKD with both 12-lead (AUC 0.843 [0.836–0.852]) and 1-lead ECG waveform (0.824 [0.815–0.832]).”
First let’s review what AUC means. The Area Under the Curve (sometimes Area Under the Receiver Operator Curve, AUROC) is used for classification problems. It shows how likely an algorithm is to classify things correctly.
Questions like:
Is this a cat or dog (in many, many famous AI papers)?
Does this person have X medical problem (in many, many famous medical papers).
For this medical paper, the question is whether this person has CKD or not.
The AUC is usually the True Positive Rate (TPR) on the Y axis, which is the same as sensitivity which is also the same as recall (thanks, statistics!). On the X axis, it’s usually True Negative Rate (NPR), which is 1-specificity (again, this is why people think statistics is confusing).
An AUC of 1 means the model is perfectly distinguishing cat from dog or CKD from no CKD. Above 0.95 would be really great.
An AUC of 0 means the model is always wrong; it always labels cats as dogs, and vice versa.
An AUC of 0.5 means the model can’t tell one from another; it’s a coin toss.
So what does that first line in the Results section mean: “deep learning algorithm achieves discrimination for CKD of any stage with an AUC of 0.767 (95% CI 0.760–0.773) in a held-out test set and an AUC of 0.709 (0.708–0.710) in the external cohort.
The algorithm had a 70% (AUC of 0.709) chance of distinguishing between CKD vs no CKD for data that’s not from the same set it was trained on.
Then they looked at whether the algorithm did better at distinguishing mild/moderate/severe CKD, but the AUC was around 0.75-0.78 for all of those. Then they tell us that the model has a higher chance of distinguishing CKD for patients under 60 - around 84%.

https://towardsdatascience.com/understanding-auc-roc-curve-68b2303cc9c5
On to the next paper, Machine learning for ECG diagnosis and risk stratification of occlusion myocardial infarction
In this results section, the results section is less quantitative: “Using 7,313 consecutive patients from multiple clinical sites, we derived and externally validated an intelligent model that outperformed practicing clinicians and other widely used commercial interpretation systems, substantially boosting both precision and sensitivity.”
They don’t give you actual numbers, so we’ll flip to the Results section: “Our model generalized well and maintained high classification performance (AUROC 0.87 (95% CI 0.85–0.90)), outperforming the commercial ECG system (AUROC 0.75 (95% CI 0.71–0.79), P < 0.001) and practicing clinicians (AUROC 0.80 (95% CI 0.77–0.83), P < 0.001) ”.
The abstract says the algorithm substantially boosts precision (PPV) and sensitivity (TPR/Recall), and in the graph below we can see that the AUC for the ECG-SMART (the algorithm the authors developed) is on the red line and covers more area than the purple (clinical experts) or yellow (commercial ECG system). I had to go all the way into the supplementary materials for this graph, even though it’s the most interesting figure in the whole paper.
In this case, the model had an 87% chance of accurately predicting OMI (AUROC 0.87).
Note that in the figure below, the authors thoughtfully label the Y axis “Sensitivity” instead of “TPR” (since it’s published in a more medically-focused paper) and the Y axis as “1-specificity” (aka the True Negative Rate). Also note that I’m showing you the figure for the external data validation; the AUC was higher for the data from the training set and the “hold out test set” (meaning the portion of the original training data that was “held out” from the training set so they could test the algorithm.
To summarize, you’re now familiar with the main ways AI performance is described (accuracy, precision, recall, AUC) and have practiced going through two new papers that describe novel findings related to ECGs. In next week’s newsletter, we’ll look at some companies that are using AI for ECG interpretation and how they report their performance metrics.

Community News
If you haven’t introduced yourself, please do so under the #intros channel.
Thanks for being a part of this community! As always, please let me know if you have questions/ideas/feedback.
Sarah
Sarah Gebauer, MD